QGIS plugin for Schapi

Yves Jacolin
The Schapi "ensures the operational mission of validation, production and dissemination of a flood monitoring system. It pilots the VIGICRUES network both from an operational point of view and in the framework of the prospective towards new tools". For this purpose Camptocamp was entrusted with the maintenance and development of several QGIS plugins. "The Schapi is also in charge of the administration of the French national hydrometric database, the HYDRO bank, within the framework of the Water Information System (WIS)".
Thus the 5 plugins are all linked to this context. We are going to present these plugins, then the missions carried out by Camptocamp and our work over the last 2 years.
Plugins

Lamedo
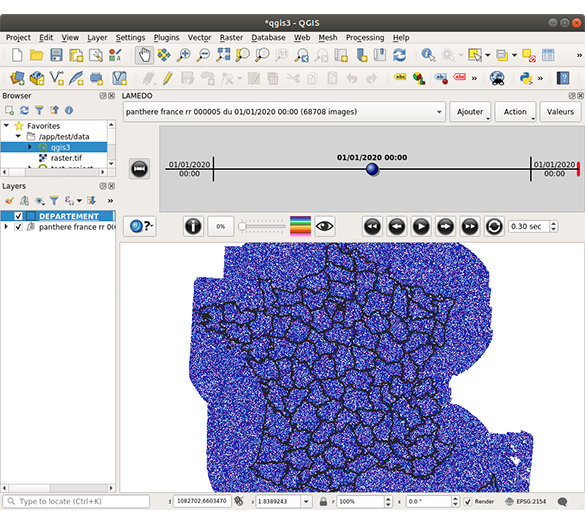
The need that gave birth to this project is the use of "non-standard" WMS flows, internal to the Schapi by non-geomatics business users. These flows had to be able to be visualized within QGIS, a software widely distributed within the various departments of the Ministry of Ecological and Solidarity Transition. These flows can be considered as non-standard insofar as the values of the parameter LAYERS are structured in a logical and dynamic way: there is no exhaustive and limited list of layers, therefore different flows exist and are built on demand.
After loading in QGIS image collections from Météo France services, the plugin allows to :
- browse the image collections in a synchronized way according to time;
- play the animation of the different collections loaded in the map block of QGIS;
- export animations in image or video formats;
- consult numerical values from specific associated web services;
- export numerical values in CSV format.

Repères de crues
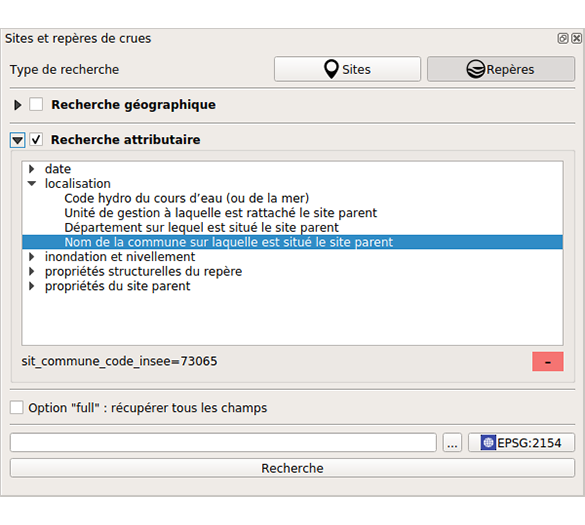
This plugin allows the consultation, in QGIS, of the data of the flood marker site. It thus allows :
- to search for sites and flood markers by different geographical and attribute filters;
- to retrieve the corresponding records from the remote service;
- and display them in QGIS.

CartoZI
The CartoZI plugin aims at facilitating the construction of flooded areas using QGIS and offering the user a series of data processing modules based on GRASS.

VIGInond Format
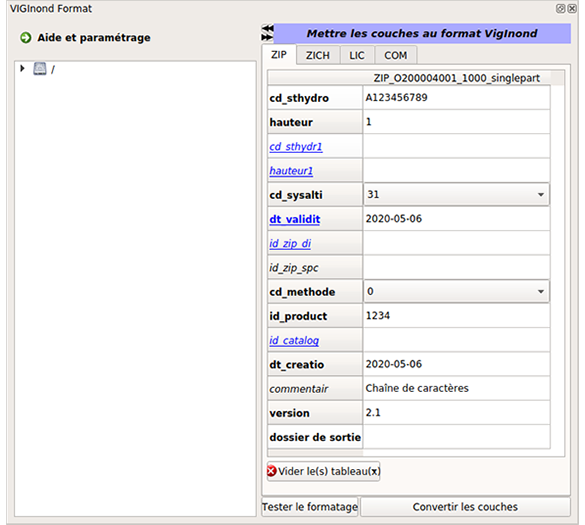
The VIGInond Format plugin allows the conversion of existing vector data related to flooded areas to the formats of the national database of flooded areas realized by the SCHAPI (VIGInond). The plugin allows the formatting of :
- Potential Flooded Zones (ZIP)
- Height IsoClass Zones (ZICH)
- IsoCote Lines (LIC)
- Communes (COM)
VIGInon INVITE
The VIGInond INVITE plugin allows to browse the layers available in the national database of flooded areas, then to display them in the QGIS software.
Missions and work carried out
The missions carried out can be classified in two phases. A first phase consisted in analyzing the plugins to prepare their migration to QGIS 3.x and to consolidate them. Their consolidation was necessary because some plugins had been developed internally and flaws were known. The Schapi therefore wanted to correct these flaws: adding unit tests, modal windows, better error management.
A second phase enabled the migration and consolidation to be carried out on the basis of the first analysis. It constitutes the basis for future developments.
Camptocamp would like to thank the Schapi for their renewed confidence in this agreement.
You would like to know more?
Please feel free to contact us.
Career
Interested in working in an inspiring environment and joining our motivated and multicultural teams?
- Senior Infrastructure Engineer (m/f/d) - Zurich/Olten
- ERP Consultant Odoo Smartcamp (m/f/d) - France
- IT Project Manager (m/f/d) - Zurich/Olten
- GIS Technical Consultant (m/f/d) - Zurich/Olten
- ERP Consultant Odoo Smartcamp (m/f/d) - Zurich/Olten
- Odoo Developer Internship (m/f/d) - Chambéry
- Odoo Developer (m/f/d) - Olten/Zurich/Munich
- ERP Project Manager (m/f/d) - France


