Baremaps Studio - Part 2
Change your mindset about the map publication process - Use case

Florent Gravin
In a previous article, we've presented the innovative approach of Baremaps Studio. Let’s now have a look at a concrete use case to showcase the power of the Studio.
We will create relevant maps based on the dataset "Lethal Road Accidents" in Bretagne.
Import a dataset into your map
There is a lot of open data freely available and it is very easy to get. For this showcase, we will simply download an accident data set from Geobretagne.
First steps are quite simple and explicit
- Get your dataset
- Push it to Baremaps Studio
- Create a new map
- Import your dataset in your map
- Boom
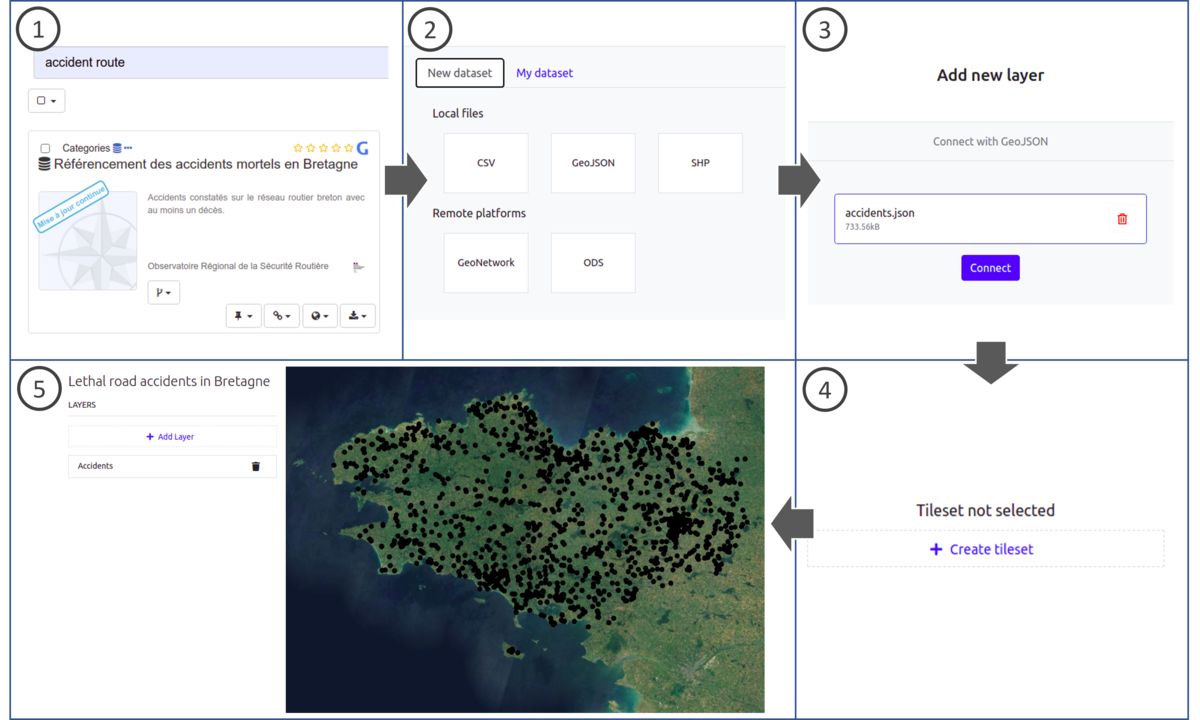

What is happening here?
While adding a dataset to your map, Baremaps internally updates its tileset definition. It adds a new vectorLayers object, and specifies a default SQL query for all zoom levels, which basically selects all objects from the dataset.
This tileset configuration describes the content of the vector tiles. With this configuration, Baremaps will provide a MVT stream for this tileset which contains points for accident locations, and all attributes that are in the dataset.
Note that you can specify several queries for a dataset, which means you control the representation of your dataset depending on the zoom level.
Also note that you can have several datasets within the same tileset, which means the client only needs to load one vector tile stream in your map.
Make your dataset talk
The studio UI provides the tools to customize the rendering of your dataset, to make them talk. It just relies on Mapbox Style specification to render the dataset from their attribute content.
As we have seen before, the query is defined in SQL. This means that we can now unleash the entire potential of PostGIS for your dataset representation. Let’s have a closer look at that.
1. Attribute join
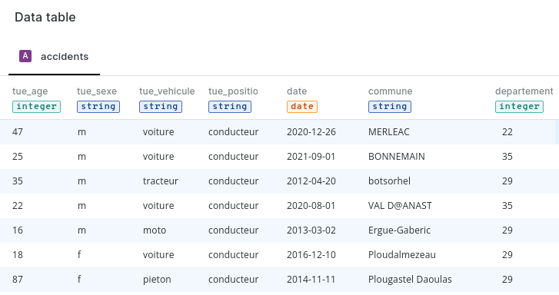
Let’s inspect the content of our dataset. Here we can see the different attributes:
We see that there is a code for the department. So we want to have a spatial representation of the accident occurrence throughout the departments, by joining the dataset through the department code to a department geometry dataset.
We can have the department layer from OSM data, already in the storage thanks to Baremaps OSM import pipeline.
Now, in the layer representation, instead of choosing simple points representation, let’s choose aggregation by attributes. Target the other dataset (departments) and pick the joining column.
The studio now configures the tileset SQL query as follows:
select d.id                                                                                                 as id,
      hstore(ARRAY ['count', count(*)::text, 'code', a.tags -> 'departement', 'nom', d.tags -> 'NOM_DEP']) as tags,
      d.geom                                                                                               as geom
from "d7208ede-6397-44c6-b646-f4b09fca35e3" as a
      LEFT JOIN "11994650-42fc-4727-9727-443cc4143e92" as d
                ON d.tags -> 'INSEE_DEP' = a.tags -> 'departement'
group by d.id, d.geom, a.tags -> 'departement', d.tags -> 'NOM_DEP')

While composing the tile, Baremaps fetches the aggregation instead of the content of the accident table as before.
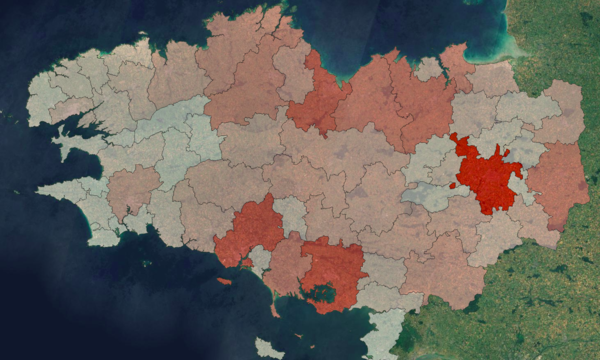
Adding a data driven style (based on expression), you can easily provide a nice choropleth map with the distribution of accidents per department.
The image on the right shows the distribution over departments via attribute join.
2. Spatial join
What if I want the distribution over smaller administrative units like French EPCIs? You don’t have any EPCI code in the dataset. The studio can rely on PostGIS power to perform spatial joins.
Same as before, search and add the EPCI dataset to your storage, to be able to use it in the tileset definition.
When done, change the representation of the accident layer to choose spatial aggregation and pick the correct Administrative Unit dataset. As simple as it is, SQL query will be changed for.
SELECT row_number() OVER ()                      AS id,
      hstore('count', count(accident.id)::text) as tags,
      epci.geom
FROM "d3853343-cf82-4e22-9aee-89e597d41357" as epci
      JOIN "d7208ede-6397-44c6-b646-f4b09fca35e3" as accident
           ON st_contains(epci.geom, accident.geom)
GROUP BY epci.geom
And here we go! Baremaps serves a vector tiles stream with EPCI geometries and a count attribute which computes the number of accidents within each geometry, and you have your more detailed choropleth based on smaller units.
3. HexBin representation
We can go even further than classic joins. Let’s imagine you would like a hexbin distribution of a dataset. As simple as before, you can choose the hexbin representation, pick your hex size and the studio will generate the proper query and will update the content of the vector tiles stream
SELECT row_number() OVER () AS id, hstore('count', count(a.id)::text), hexes.geom
FROM
 ST_HexagonGrid(
     20000,
     ST_SetSRID(ST_EstimatedExtent('d7208ede-6397-44c6-b646-f4b09fca35e3', 'geom'), 3857)
   ) AS hexes
   INNER JOIN
 "d7208ede-6397-44c6-b646-f4b09fca35e3" as a
 ON ST_Intersects(ST_SetSRID(a.geom, '3857'), hexes.geom)
GROUP BY hexes.geom;
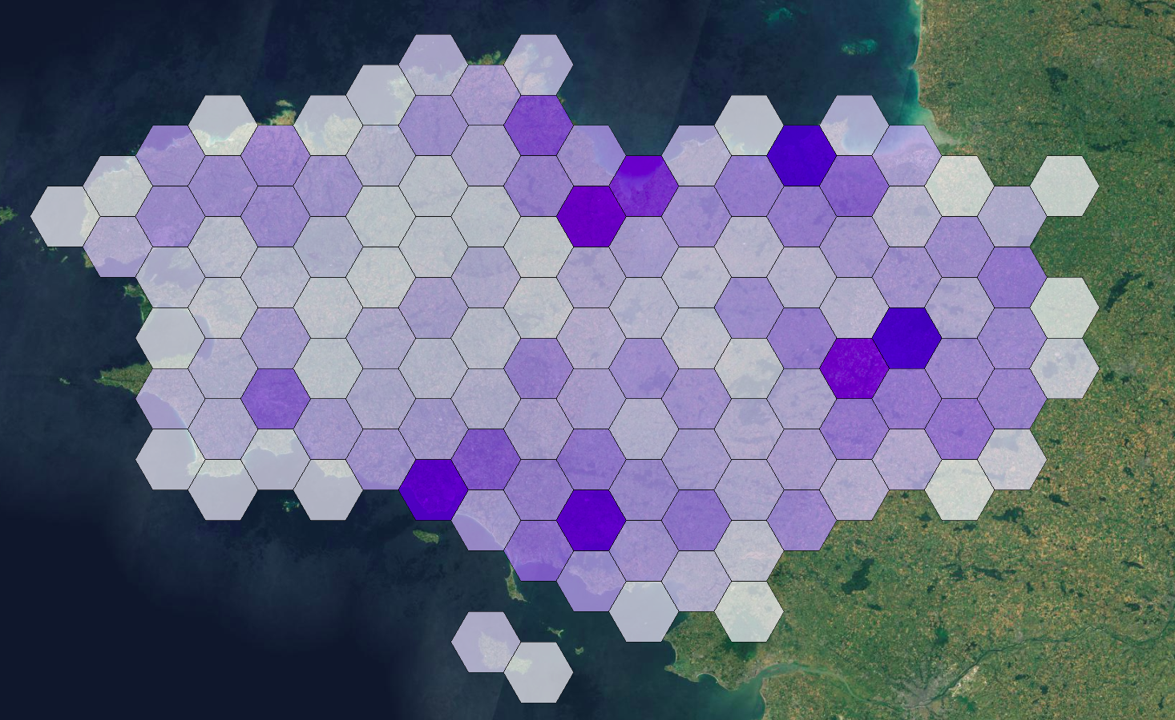
Hexbin representation of car accidents
Note that nothing is done client side, all the hexbin shapes and features come from the vector tiles.

Customize your tiles as you want
Those previous examples just illustrate the power of Baremaps studio through a concrete use case. Of course, as mentioned earlier, you can customize the content of your vector tiles stream the way you want:
- as many layers as you want
- as many subqueries (per zoom ranges) as you want
- as much complexity of each SQL query you may need to have (buffer, spatial join, functions etc.)
The output of Baremaps, whatever the complexity of your tileset configuration, will be only one MVT endpoint.
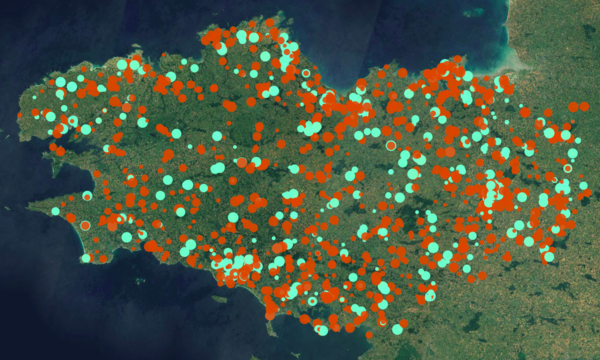
Don’t forget that Baremaps has embedded OSM data as well. So you can also easily combine OSM and custom data in the same MVT stream.
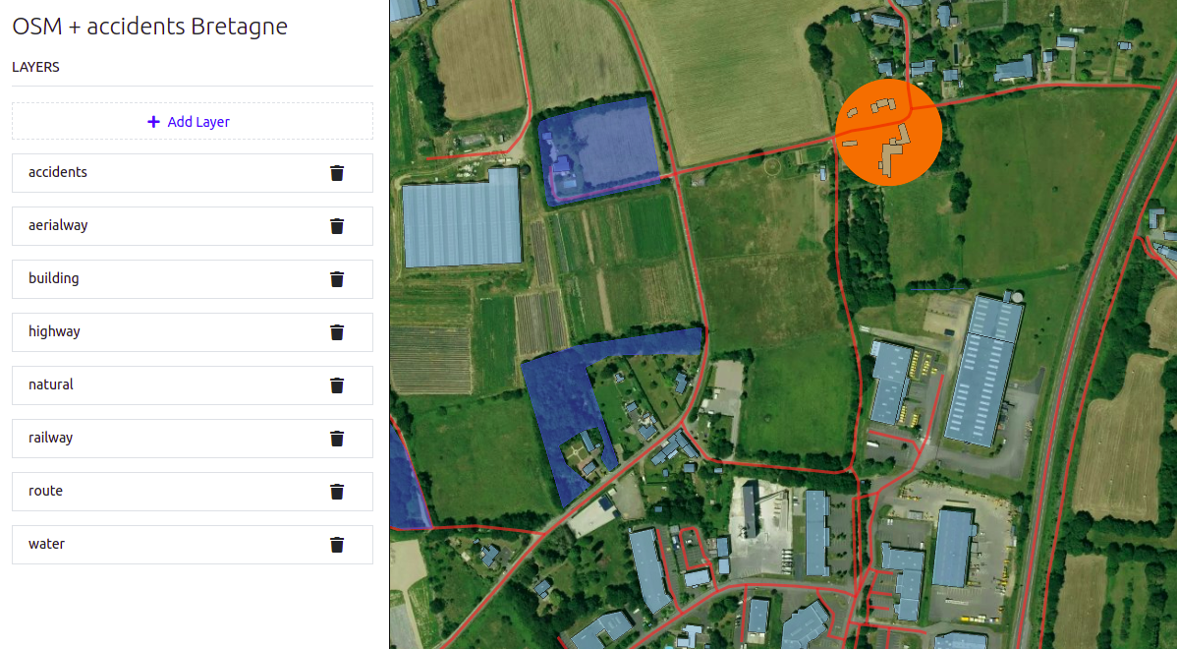
Mix of OSM data (buildings, roads, natural areas..) and accidents (orange circle)
Share and decorate your maps
Once you define your tileset, your layer content and your styling, you actually create a thematic map. Baremaps provides the backend service, the experimental studio UI provides the user backoffice for the map creation, but the end usage is the output of this work, the public map. The user, from the studio, can decide to publish the map with the current tileset and styling, via a front office public page which can be shared or embedded in third party websites. This is actually the main goal of all this architecture.
Conclusion
Baremaps introduces a new way of consuming, sharing and promoting spatial data collections. It...
- leverages vector format capacities for great visualization
- relies on OGC API standards
- sticks to the Mapbox tiling ecosystem
- unleashes PostGIS power for data processing and analysis
- provides a UI to easily create and publish your custom maps
What is shown in this article showcases a potential UI for the MVT usage, but many more things will come to make maps even more talkative and reliable (legend, popup, synchronized widgets, dataviz etc.).
Interested to learn more?
Please don't hesitate to contact us using the form below!
Career
Interested in working in an inspiring environment and joining our motivated and multicultural teams?
- Senior Infrastructure Engineer (m/f/d) - Zurich/Olten
- ERP Consultant Odoo Smartcamp (m/f/d) - France
- IT Project Manager (m/f/d) - Zurich/Olten
- GIS Technical Consultant (m/f/d) - Zurich/Olten
- ERP Consultant Odoo Smartcamp (m/f/d) - Zurich/Olten
- Odoo Developer Internship (m/f/d) - Chambéry
- Odoo Developer (m/f/d) - Olten/Zurich/Munich
- ERP Project Manager (m/f/d) - France


